Connect to Rent Manager

Enjoy limitless company dashboards and KPIs built on live data from Rent Manager.

Screenshot of a spreadsheet report titled 'Visata for Rent Manager' with report settings for profit & loss on Sheet1, date range from 03/01/2023 to 03/17/2023, including options for properties, start, and end dates, with a green 'Run Report' button and a saved indicator.

How it works

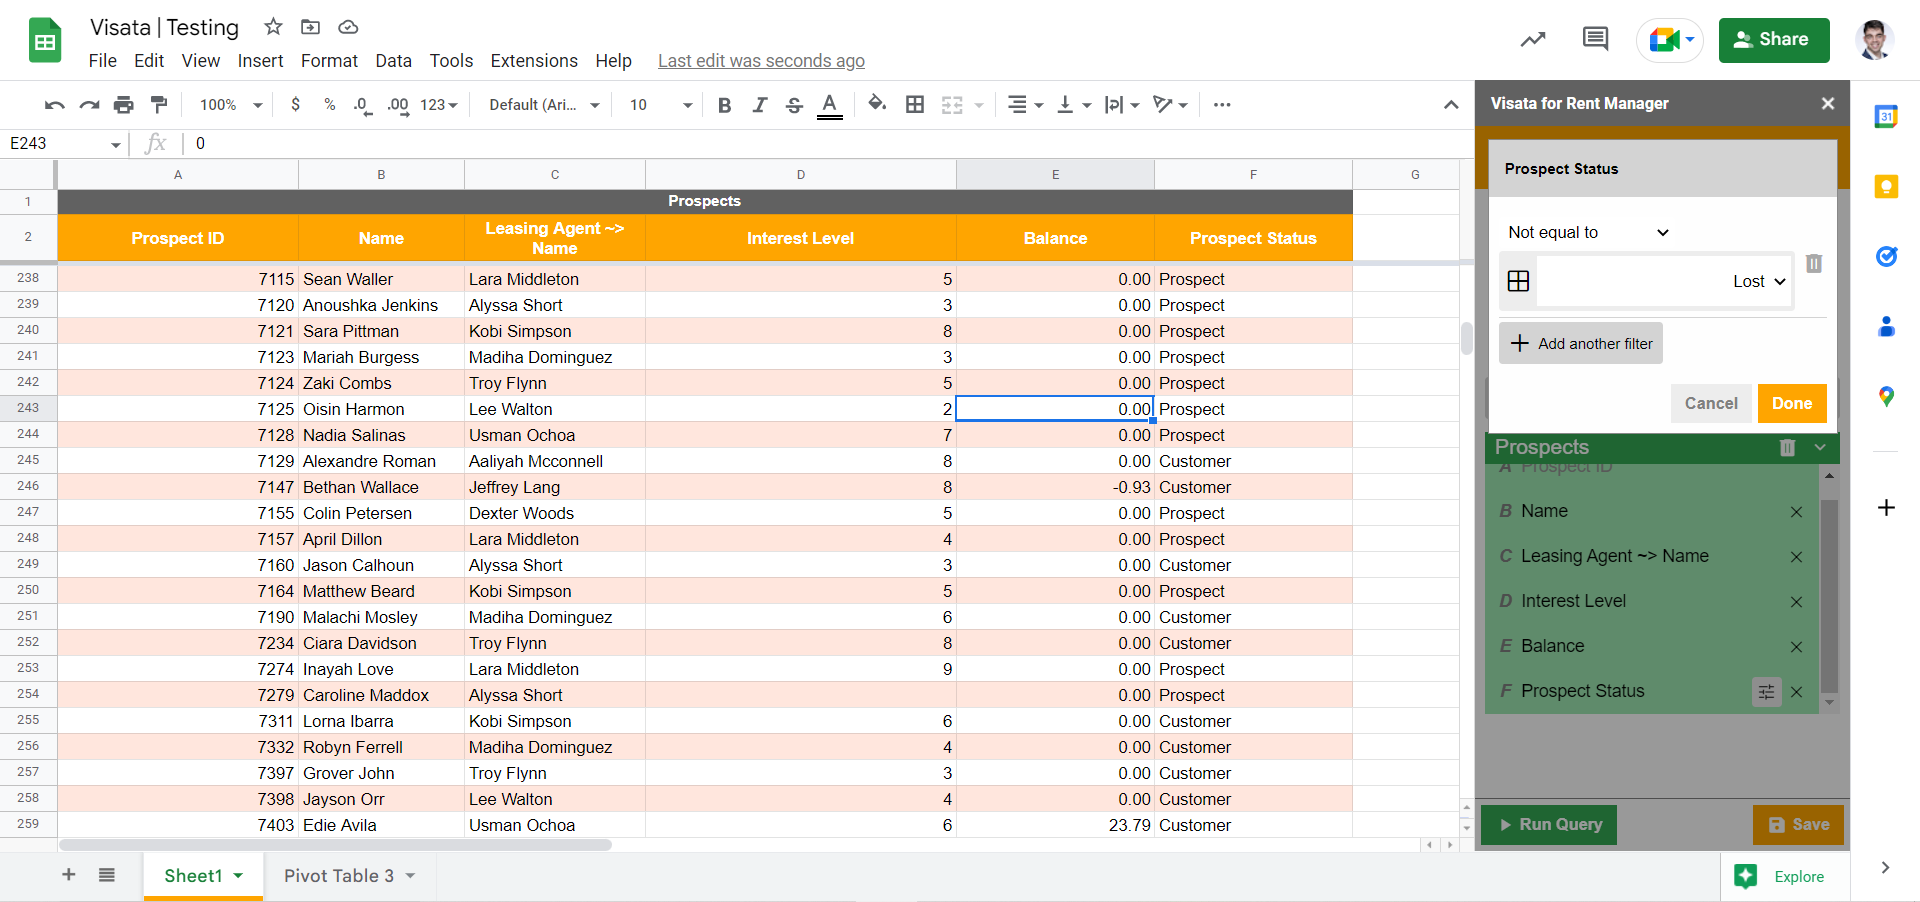
Our app allows you to seamlessly run reports from Rent Manager directly into your spreadsheets from a sidebar (zero coding required!), and automatically refresh in the background. From there, you can build dashboards, custom reports, and anything else you want without ever needing to manually update the data.

Data made simple. Insights made powerful.

Dashboard templates

Choose from various dashboard templates that are completely customizable at any time, including prospect pipeline, marketing, financial statements, receivables breakdown, maintenance issues, budget analysis, and more.

Dashboard displaying lease signing statistics with gauges showing apply rate at 89.2% and close rate at 49.1%, a bar chart of leased signed by source, and a table with prospect details.
Financial dashboard displaying pie charts of revenue and expenses categories, a list of property names on the right, account summaries, bar graph of income and expenses from January to August 2023, with income consistently higher than expenses, and showing an income of $863,569.36, expenses of $524,649.85, and a gain of $338,919.51.
Dashboard displaying real estate data, including a pie chart of charge types, a list of properties with outstanding balances, and a bar graph showing outstanding amounts over several months with color-coded categories for different balances.

How do I get started?