
Our templates
Profit & Loss
Get real-time insights into your financial performance, identify trends, and make data-driven decisions. Streamline your financial analysis and stay ahead of the market with clear, actionable insights.

Box Score
Tailored for the dynamic real estate market, this tool helps you track and manage potential clients effectively. From initial contact to closing, streamline your sales process, enhance client engagement, and boost your conversion rates. Ideal for real estate companies looking to expand their client base and increase sales.

Aged Receivables
Tailored for real estate companies, this tool offers a comprehensive view of outstanding payments, helping you prioritize collections and maintain healthy cash flow. Stay on top of your receivables, reduce financial risk, and enhance your financial stability with effortless visibility.

Delinquency
This dashboard not only highlights tenant delinquencies but also offers deep insights into the sources of delinquency – be it by property, tenant, charge type, or age of charges. Gain a comprehensive understanding of where and why delinquencies occur, enabling you to take targeted actions to mitigate risks, preserve property value, and maintain a consistent revenue stream. This tool is an essential asset for proactive financial management and maintaining a healthy portfolio.

Service Issues
Keep track of maintenance requests, service issues, and resolution timelines efficiently. This dashboard helps real estate companies ensure tenant satisfaction, maintain property conditions, and optimize operational efficiency. Stay ahead of maintenance needs and maximize efficiency of your in-house or out-sourced tech.

Mobile Home Inventory
Tailored specifically for the unique needs of the mobile home sector, this dashboard provides a real-time, comprehensive breakdown of your inventory statuses. Easily track and manage various categories such as occupied, vacant, under repair, or up for sale units. Ideal for staying ahead in the fast-paced mobile home market, our dashboard simplifies portfolio management and boosts operational efficiency.

Map of Properties
Designed to cater to the dynamic needs of real estate professionals, this dashboard offers an intuitive map view of all your properties. Drill down into specific regions, filter properties by various criteria such as type, group, or occupancy status, and gain immediate insights. Seamlessly integrated with RMX, each property on the map has a link to take you straight into Rent Manager.

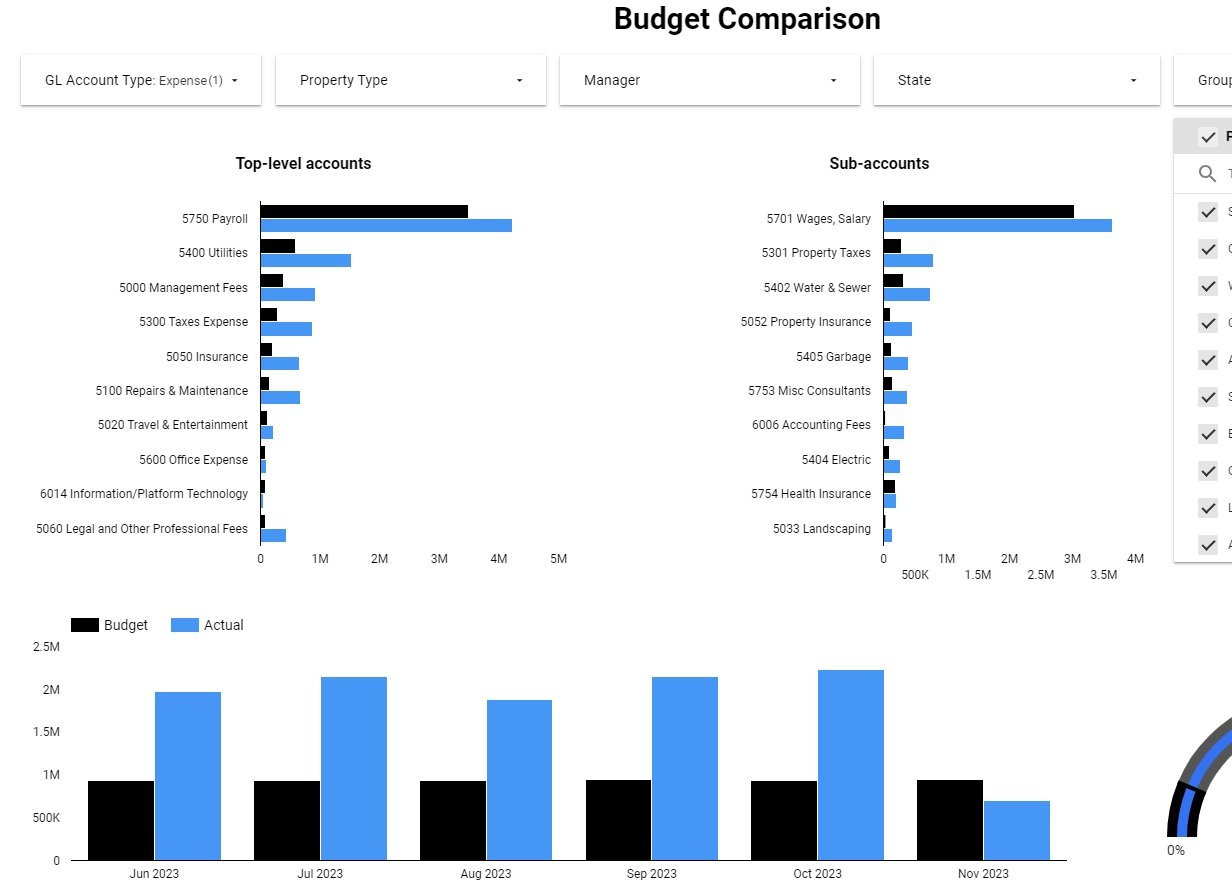
Budget Comparison
Streamline your real estate financial management with our intuitive Budget vs. Actual Dashboard. This tool offers a clear, real-time view of your financial performance, comparing your budgeted projections with actual results. It's the perfect solution for maintaining financial accuracy and optimal resource allocation in every project. With this dashboard, make smarter decisions, keep a firm handle on your financial status, and propel your real estate business towards sustained growth with confidence and ease.
MH Inventory Lifecycle
Our "Inventory Life Cycle" dashboard template is an essential tool for real estate companies specializing in the manufactured housing industry. This comprehensive and meticulously designed template provides a seamless overview of your inventory's journey, from preparation to sale. It meticulously tracks and displays prep times, sale times, and a detailed history of each property in your portfolio, offering invaluable insights into the efficiency and effectiveness of your operations. Whether you're looking to optimize your inventory turnover, enhance your property preparation processes, or gain a deeper understanding of your sales cycle, our dashboard template is tailored to meet the unique needs of the manufactured housing sector.

Occupancy
Introducing our leasing dashboard template, a powerful tool designed to transform the way real estate businesses manage their leasing operations. Tailored specifically for property management professionals, this dashboard offers real-time insights into move-ins, move-outs, and occupancy rates over time. By visualizing these critical metrics in an intuitive and accessible format, our template enables you to monitor the health of your portfolio at a glance and make informed decisions to maximize occupancy and minimize vacancies.

Utility Recapture
Our Profit & Loss dashboard can be modified/filtered to show you your utility accounts which turns it into a utility recapture dashboard! By tracking and analyzing energy usage in real time, you can identify inefficiencies, reduce waste, and recapture costs that might be slipping through the cracks. This powerful tool puts the control in your hands, offering detailed insights and actionable data to optimize utility spending and drive sustainable savings.

Prospect Breakdown
Take control of your sales pipeline with our Prospect Breakdown Dashboard. Track the progress of every lead with real-time visibility into statuses, stages, and interest levels, all in one place. Effortlessly filter through prospects to focus on those most likely to convert, while gaining valuable insights into engagement and next steps. This dashboard gives you the power to optimize follow-ups, prioritize high-potential opportunities, and drive better results.

Violations
Effortlessly track and manage property violations with our Violations Dashboard, designed specifically for real estate companies. Gain real-time insights, filter violations by status, property, or severity, and ensure timely resolutions—all in one place. Stop letting fines and compliance risks pile up—take control with a streamlined, data-driven approach to violations management. Stay compliant, reduce risk, and protect your bottom line.

Prospect Pipeline
Stop losing valuable leads and start closing more deals with our Prospect Pipeline dashboard. Identify exactly where prospects drop off, analyze key performance metrics, and fine-tune your strategy for better results. With clear, actionable insights at every stage of your funnel, you'll turn more inquiries into leases and sales. Don’t let leads slip away—turn insights into revenue!

Lease Renewals
Stay ahead of lease expirations with our Lease Renewals Dashboard—built for busy property management teams. Get instant visibility into upcoming renewals, filter by property, lease end date, or tenant status, and never miss a critical deadline again. Streamline communication, reduce vacancy risk, and keep occupancy high with proactive, data-driven lease management. Make renewals easy, efficient, and profitable—all from one powerful dashboard.
